

CPI taken from https://www.bls.gov/data/inflation_calculator.htm
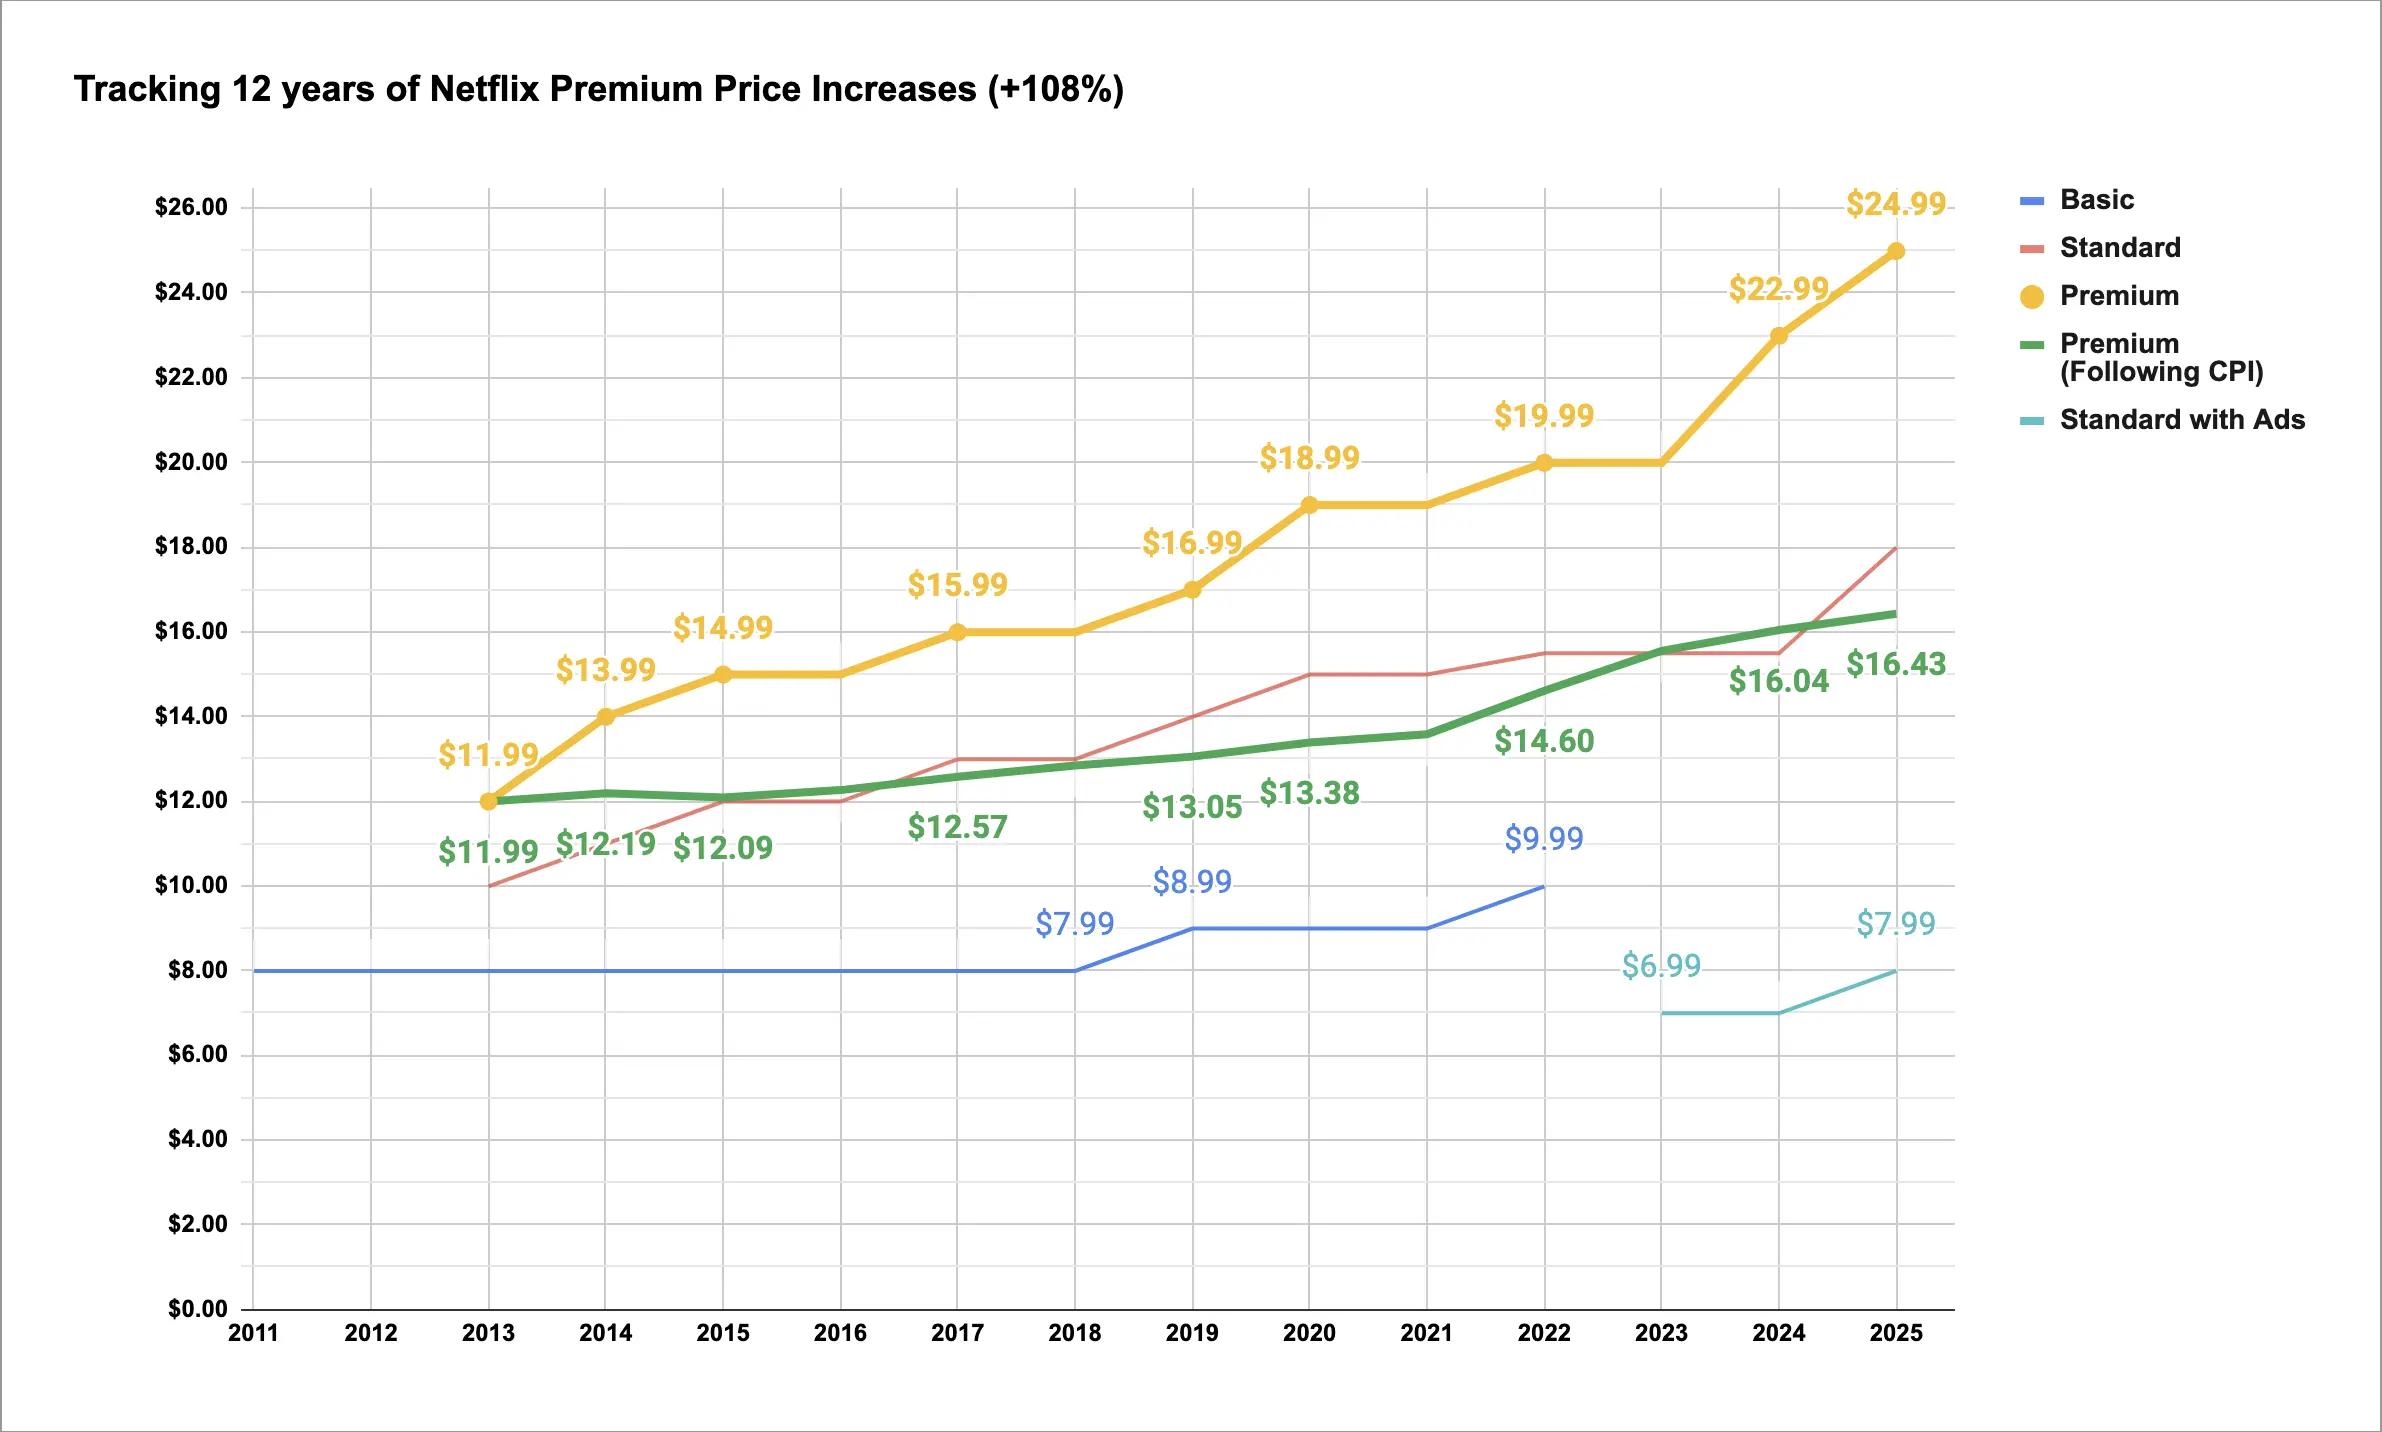
I fudged the CPI calculation a bit because I didn’t do the compounding monthly, but I ensured that based on the CPI calculator, the starting value of $11.99 -> $16.43 from January 2013 -> December 2024.
To be fair, I think CPI is somewhat bullshit, but it was the easiest .gov source for inflation data that I knew about.
Data:
| Year | Basic | Standard with Ads | Standard | Premium | Premium Following CPI | CPI Inflation % |
|---|---|---|---|---|---|---|
| 2011 | $7.99 | - | - | – | - | - |
| 2012 | $7.99 | - | - | – | - | 1.60% |
| 2013 | $7.99 | - | $9.99 | $11.99 | $11.99 | 1.58% |
| 2014 | $7.99 | - | $10.99 | $13.99 | $12.19 | -0.89% |
| 2015 | $7.99 | - | $11.99 | $14.99 | $12.09 | 1.37% |
| 2016 | $7.99 | - | $11.99 | $14.99 | $12.26 | 2.50% |
| 2017 | $7.99 | - | $12.99 | $15.99 | $12.57 | 2.07% |
| 2018 | $7.99 | - | $12.99 | $15.99 | $12.84 | 1.55% |
| 2019 | $8.99 | - | $13.99 | $16.99 | $13.05 | 2.49% |
| 2020 | $8.99 | - | $14.99 | $18.99 | $13.38 | 1.40% |
| 2021 | $8.99 | - | $14.99 | $18.99 | $13.58 | 7.48% |
| 2022 | $9.99 | - | $15.49 | $19.99 | $14.60 | 6.41% |
| 2023 | Phased Out | $6.99 | $15.49 | $19.99 | $15.55 | 3.09% |
| 2024 | – | $6.99 | $15.49 | $22.99 | $16.04 | 2.33% |
| 2025 | – | $7.99 | $17.99 | $24.99 | $16.43 | - |
edit: Zeroed y axis

2 points

