Based on https://privacytests.org

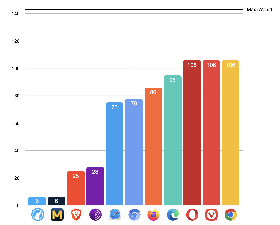
Desktop browsers in their current stable versions, sorted from better (left) to worse (right). These are:

Librewolf, Mullvad, Brave, Tor, Safari, Chromium/Ungoogled, Firefox, Edge, Opera, Vivaldi, Chrome.

Note: Each test is counted with a value of one in this chart, however each test may not have an equal importance in regard to privacy. It still gives an image of which browsers value privacy and which do not.

The maximum (worst possible) score is 143.

Edit: Also FUCK BRAVE. But for other reasons than these points. Read the description before you vote or comment ffs…

You are viewing a single thread.
View all comments View context
1 point

They are FF with the defaults set to “I don’t care if enabling this breaks my websites”.

Telemetry is personal preference. Sending that data to a company you trust to use it for the stated purpose (making Firefox better) is a choice, and FF lets you easily disable it.

permalink
report
parent
reply
2 points

I don’t care if enabling this breaks my websites

I haven’t experienced any website breakage with Librewolf. Mullvad breaks websites because it has noscript by default (even though uBlock Origin has noscript built in).

permalink
report
parent
reply
2 points

Then that’s my point illustrated. It’s easy to make a browser 100% secure, you just take it off the Internet.

The middle ground is the hard part. Supporting both is the hard part

permalink
report
parent
reply
2 points
*

If you’re already used to running an assortment of privacy-oriented additions on another browser, librewolf breaks in familiar ways… but it still breaks.

permalink
report
parent
reply
1 point

For example?

permalink
report
parent
reply

Data is Beautiful

!dataisbeautiful@lemmy.world

Create post

A place to share and discuss visual representations of data: Graphs, charts, maps, etc.

DataIsBeautiful is for visualizations that effectively convey information. Aesthetics are an important part of information visualization, but pretty pictures are not the sole aim of this subreddit.

A place to share and discuss visual representations of data: Graphs, charts, maps, etc.

  A post must be (or contain) a qualifying data visualization.

  Directly link to the original source article of the visualization
    Original source article doesn't mean the original source image. Link to the full page of the source article as a link-type submission.
    If you made the visualization yourself, tag it as [OC]

  [OC] posts must state the data source(s) and tool(s) used in the first top-level comment on their submission.

  DO NOT claim "[OC]" for diagrams that are not yours.

  All diagrams must have at least one computer generated element.

  No reposts of popular posts within 1 month.

  Post titles must describe the data plainly without using sensationalized headlines. Clickbait posts will be removed.

  Posts involving American Politics, or contentious topics in American media, are permissible only on Thursdays (ET).

  Posts involving Personal Data are permissible only on Mondays (ET).

Please read through our FAQ if you are new to posting on DataIsBeautiful. Commenting Rules

Don't be intentionally rude, ever.

Comments should be constructive and related to the visual presented. Special attention is given to root-level comments.

Short comments and low effort replies are automatically removed.

Hate Speech and dogwhistling are not tolerated and will result in an immediate ban.

Personal attacks and rabble-rousing will be removed.

Moderators reserve discretion when issuing bans for inappropriate comments. Bans are also subject to you forfeiting all of your comments in this community.

Originally r/DataisBeautiful

Community stats

  • 2.7K

    Monthly active users

  • 70

    Posts

  • 1.4K

    Comments