

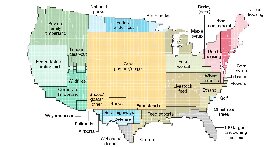
It is absolutely blowing my mind how many people are looking at this and thinking that is trying to show, like, primary land use per block on the map or something?
Like it’s well-known that maple syrup comes exclusively from northwest PA, plus all the logging that happens in downtown San Francisco and LA.
Is this a glorified pie chart? Follow-up question: Why is this not just an actual pie chart?


the added context of the US map gives it some utility that a pie chart, which is just straight trash, does not have
a bar graph or even just a table would convey similar information more precisely and usefully, but if your only goal is to give an intuitive sense of the land use (not writing policy or anything here) it suits
Pie charts are useless in general.
For the example shown here there are way too many categories for a pie chart. You would not be able to see anything past the top 3 or so categories as the slices get too thin and the labels would be all over the place.
Lastly you would miss out on the size comparisons to e.g. states.
This is much better.

