You are viewing a single thread.
View all comments View context
1 point

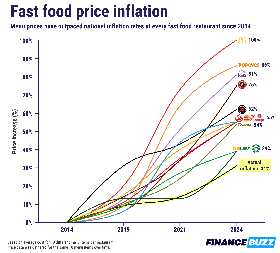
The timeline gives a general reference point. You’re right they could mostly just include 2014 and the final year as well. No big deal in my opinion since they don’t try to emphasize the price points at each year (as only a vague idea is given based on the line).

In terms of your second point, what if from '99 to 2003, Mcdonald’s had doubled their prices? the graph would be the same? We can keep going back until each business’s complete history, but I feel this graph tells enough of a story: Both brands increased their product costs a certain amount from the dates indicated.

permalink
report
parent
reply

A Boring Dystopia

!aboringdystopia@lemmy.world

Create post

Pictures, Videos, Articles showing just how boring it is to live in a dystopic society, or with signs of a dystopic society.

Rules (Subject to Change)

–Be a Decent Human Being

–Posting news articles: include the source name and exact title from article in your post title

–Posts must have something to do with the topic

–Zero tolerance for Racism/Sexism/Ableism/etc.

–No NSFW content

–Abide by the rules of lemmy.world

Community stats

  • 6.6K

    Monthly active users

  • 806

    Posts

  • 26K

    Comments

Community moderators