Source of data: https://dataverse.harvard.edu/dataset.xhtml?persistentId=doi:10.7910/DVN/T0HSJ1

Edit: removed OC as it’s not (sorry)

You are viewing a single thread.
View all comments View context
15 points

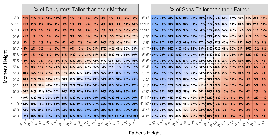
The X and Y are just labeled weird, both graphs reference father’s height has the X and mother’s height as the Y

permalink
report
parent
reply
1 point

Oh, completely missed that, thanks!

permalink
report
parent
reply
5 points

Yeah, but there is no graph comparing son vs mother and daughter vs father.

And it seems like an odd thing to omit.

permalink
report
parent
reply
9 points

If I’m reading the referenced link right, the data is from 1886(?), so it’s not terribly recent, either.

permalink
report
parent
reply
1 point

yes, 928 children and 205 parents it seems.

wonder how the trend shown here has changed in almost 150 years…

permalink
report
parent
reply
1 point

Wow, thanks for checking on that

permalink
report
parent
reply

Data is Beautiful

!dataisbeautiful@mander.xyz

Create post

Be respectful

Community stats

  • 2.4K

    Monthly active users

  • 100

    Posts

  • 1.6K

    Comments