

Interesting data, but I don’t think it is beautifully presented. Bar charts, or maybe a blown up pie charts may be easier to grasp the scale.
Blobs of the largely same color, dispersed in a random pattern make it hard to quickly see scale
It’s like yesterdays post https://lemmy.ml/post/2352771 with a map of the US. The circle could represent earth.
I’m sure this has zero side effects…

A bit confusing. Normal circumferences or a bar graph would be much more informative and easier to compare.
What sucks is that wild animals used to be everywhere! You could walk into a forest and easily see dozens of animals. But most of them have been killed off from over hunting in the 19th century and environment encroachment.
Also, in a lot of places it has become really hard to find the thing that was considered a forest a few hundred years ago. All we have now in Germany are spruce or pine plantations where the only animals you can find are ants.
You guys don’t have forest land anymore? That is an absolute tragedy! I’m really sorry to hear that for you guys. I have to get to the wilderness at least once every couple of months or I lose my mind. I get super stressed out, claustrophobic, and depressed. Spending a weekend in the wilderness is a much needed reset. Thank goodness for Teddy Roosevelt’s National Park programs and general land conservation efforts here in the US.
We have a few national parks, but they’re not nearly as big or as old as the ones in the US. And there are no more native forests, every one of them has been man made at some point. Within national parks and some other areas, they’re trying to let nature take over again but it’s a slow process. In one national park (Harz) they’ve stopped trying to save the spruce trees that were never supposed to be there, and they’re all dying from drought, climate change and bark beetles:
https://assets.deutschlandfunk.de/403b1645-9795-4a2c-ad31-43f00c903cb5/1920x1080.jpg
I’m sure something better adapted to the conditions will come in after the spruce is gone, but it’s a work in progress.
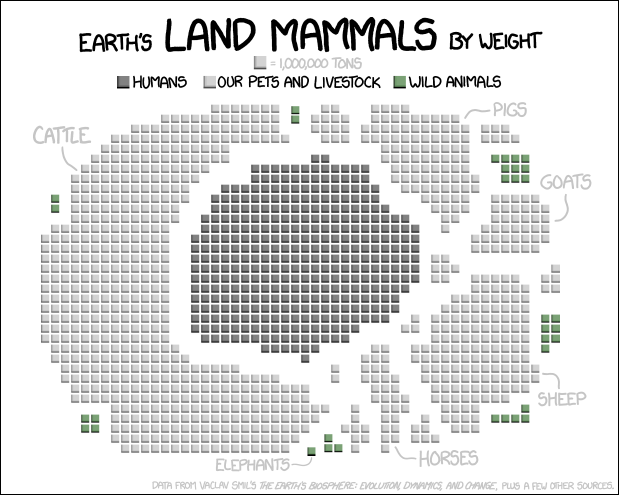
This is good, but presenting the blobs as such different shapes makes it harder to get a sense of relative size. (Obviously some of the differences are huge enough it doesn’t matter, but comparing humans and cattle say.)
And which blob is chickens? I guess chickens are so much smaller and lighter than other domestic animals they don’t show very big here.
Another suggestion would be to not include the number of blocks in the label. That doesn’t make sense. If you want an absolute number to be included, but the weight (scaled to millions of tons appropriately). It is less abstract than number of blocks.
Also, this is more subjective, but the font makes it look very amateur in my opinion.

It’s specifically a visualization of land mammals, so chickens wouldn’t appear, being birds.
Fair enough, but in a way chickens kinda should be on there anyways. They can’t exactly fly very far, spend like 98% of their life on the ground, and humans breed them for food.
They don’t spend 98% of their life on the ground in the wild. They sleep in trees, just like turkeys and peacocks.

