


What the heck is real life number

An actual measured data point, as opposed to a randomly generated number. Also this principle applies specifically to the first digit. Overall the title is a complete mess.
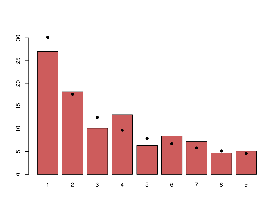
Basically, when you gather a bunch of data points about real world quantitative phenomena (e.g. town population, lake surface area, etc), you find this distribution curve of leading digits where 1 is something like 30% most frequent, gradually decreasing down to 9 being least frequent.
This is called Benford’s Law, it’s basically an emergent property about how orders of magnitude work. It’s useful because you can use it to detect fake data, since if your data faker doesn’t know about it they’ll generate fake data that looks random but doesn’t follow this distribution.
Great video on Benford’s Law here. Matt goes into a good amount of detail outlining why this occurs, why it doesn’t always apply, and what it means if data does/doesn’t follow the Law.


Here is an alternative Piped link(s): https://piped.video/etx0k1nLn78
Piped is a privacy-respecting open-source alternative frontend to YouTube.
I’m open-source, check me out at GitHub.

Does anybody know if this is a feature of a decimal system?

This is a bit weird. I was just listening to Infinity 2 today (great book. Totally recommend), and there’s a section where the characters use Benford’s Law to prove reality. I then had to look it up myself.
Just a super weird coincidence…unless Lemmy is listening to me…
We are not listening to you Travis.
That had a 1 in a million chance, but I had to try.
So if I rolled a 10 sided dice 1000 times 30% of those rolls would be a 1?
From what I understand it works like this.
Let’s say you have a series of numbers that represent real life data. In general the first number of all of these numbers will be a 1, 30% of the time.
It works on things that operate on a logarithmic scale. It’s odd how many real-world things fit that mold that don’t intuitively seem like they would.
Another factor promoting it in real-world data sets is that they often have restricted ranges that favor lower numbers. Days of the month, for example, only go from 1 to 31. There’s only one way for the leading digit to be 4, but there are eleven ways for the leading digit to be 1.
Another type of data includes values of varying ranges, which also favors lower leading numbers. Street numbers start at 1 and go up, ending at some point within a fairly large range in the real world. All of these ranges will have their fair share of leading 1s. They will NOT all have a fair share of leading 2s (what if it ended before 20?), and as you go up it gets progressively less likely. So if you took all street addresses, you’d expect to see more leading 1s than 9s.
Your theoretical dice roll is not such a case. You would expect a uniform distribution of leading numbers. This would hold true with a 99-sided die as well.
While that’s true with a 10-sided die 20% of your rolls will start with a one and all other digits only have a 10% chance.


